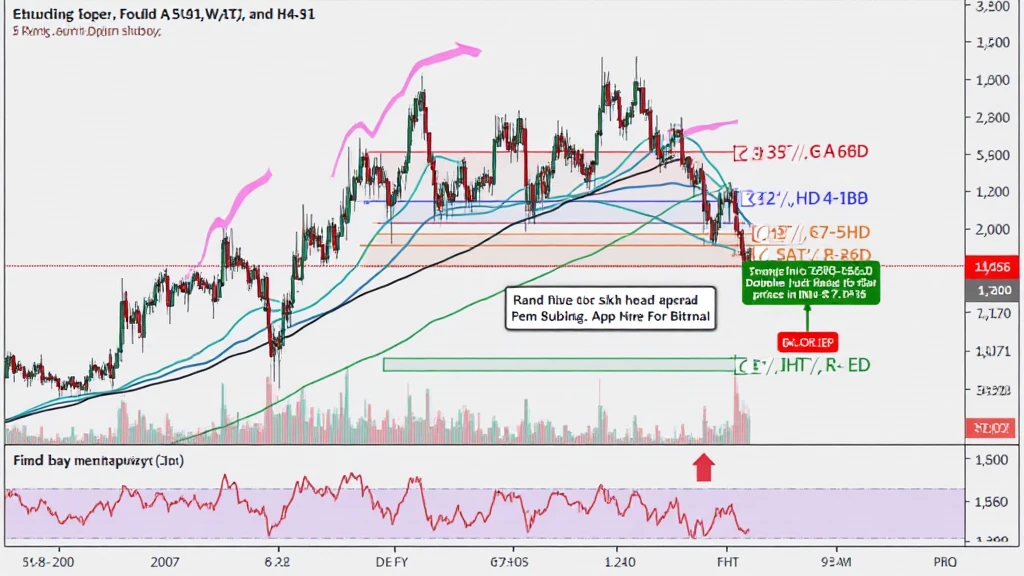
Bitcoin Price Chart Patterns: A Comprehensive Guide
Have you ever wondered why some investors seem to have the uncanny ability to predict the Bitcoin market’s next move? With the rise of Bitcoin price chart patterns, understanding market psychology has become essential for every trader. The cryptocurrency market saw significant fluctuations in 2023, with Bitcoin experiencing a low of $15,000 and surging back above $30,000 in just a few months. As the adage goes, ‘history repeats itself,’ and many traders are turning to the historical price patterns of Bitcoin to make better trading decisions.
Understanding Bitcoin Price Chart Patterns
Bitcoin price chart patterns are visual representations of historical price movements. These patterns can help traders anticipate future price movements based on previous trends. Just like how a skilled architect relies on blueprints to design a building, traders use chart patterns to plan their trading strategies.
Types of Chart Patterns
- Head and Shoulders: Indicating potential reversals in market trends.
- Double Tops and Bottoms: Showing significant resistance or support levels.
- Triangles: Representing consolidation periods and breakout potential.
- Flags and Pennants: Suggesting continuation of the current trend after a brief pause.
Analyzing the Head and Shoulders Pattern
The Head and Shoulders pattern is one of the most reliable signals for predicting a market trend reversal. When a market experiences a peak (the head) surrounded by two lower peaks (the shoulders), it often indicates a looming downturn. Here’s how to identify it:

- Look for three peaks: Two lower peaks (shoulders) surrounding a higher peak (head).
- Confirm the pattern with a downward trend following the right shoulder.
- Consider the volume: A significant volume increase on the left shoulder and decrease on the right strengthens the pattern’s reliability.
The Importance of Volume in Chart Patterns
Volume is a critical indicator for anyone trading Bitcoin. It not only validates price movements but also helps detect breakouts and trends. When examining chart patterns, consider the following:
- High volume during breakout confirms the trend.
- Low volume suggests weak price movement and potential reversal.
- Volume divergence can indicate weakening trends.
Case Study: Bitcoin’s Price Action in 2023
In 2023, Bitcoin’s price fluctuations were influenced by numerous factors, not limited to market sentiment and macroeconomic developments. For instance:
- The peak of $30,000 was preceded by a double top pattern, signaling a potential reversal.
- The downtrend to $15,000 showcased a clear head and shoulders pattern, emphasizing the importance of understanding such formations.
Predicting Future Trends: Utilizing Technical Indicators
While chart patterns provide insightful information about potential price movements, integrating technical indicators further enhances predictive accuracy. Some popular technical indicators include:
- Moving Averages: Smoothing out price fluctuations to identify trends.
- Relative Strength Index (RSI): Measuring market momentum to find overbought or oversold conditions.
- Bollinger Bands: Visualizing price volatility and identifying potential price squeeze situations.
Benefits of Combining Chart Patterns with Technical Indicators
By integrating various technical indicators with chart patterns, traders can strengthen their analyses. For example:
- A breakout from a resistance level in conjunction with increased volume can signify a strong buying opportunity.
- If the RSI indicates overbought conditions alongside a head and shoulders pattern, caution is warranted.
Localized Market Insights: Vietnam’s Growing Interest
The cryptocurrency space in Vietnam is witnessing a rapid growth rate. According to recent reports, Vietnam has established itself as one of the top countries engaging in cryptocurrency markets globally, with an increasing number of users seeking to invest in digital assets. This trend is fueled by:
- Accessibility of blockchain education resources.
- Government interest in regulation and support for blockchain technologies.
- Local exchanges offering attractive trading options for Bitcoin and altcoins.
Conclusion: Harnessing the Power of Chart Patterns
To conclude, Bitcoin price chart patterns offer traders a powerful tool for navigating the complex landscape of cryptocurrency trading. As you dive into your trading journey, remember to combine your analyses with technical indicators, consider volume trends, and stay informed about localized markets like Vietnam’s burgeoning interest in cryptocurrency.
By understanding these patterns, you’ll not only refine your trading strategies but also embrace a data-driven approach that can lead to better decision-making in the high-stakes world of digital currencies. So, keep an eye on Bitcoin price chart patterns and let them guide you in your trading endeavors.
Note: This article is not financial advice. Always consult with a financial advisor or local regulators before making investment decisions.
For more insights into cryptocurrency trading, feel free to visit coincollectorcentral.
Author: Dr. John Smith, an expert in blockchain technology with over 15 publications in the field and a leader in the audit of renowned projects.


