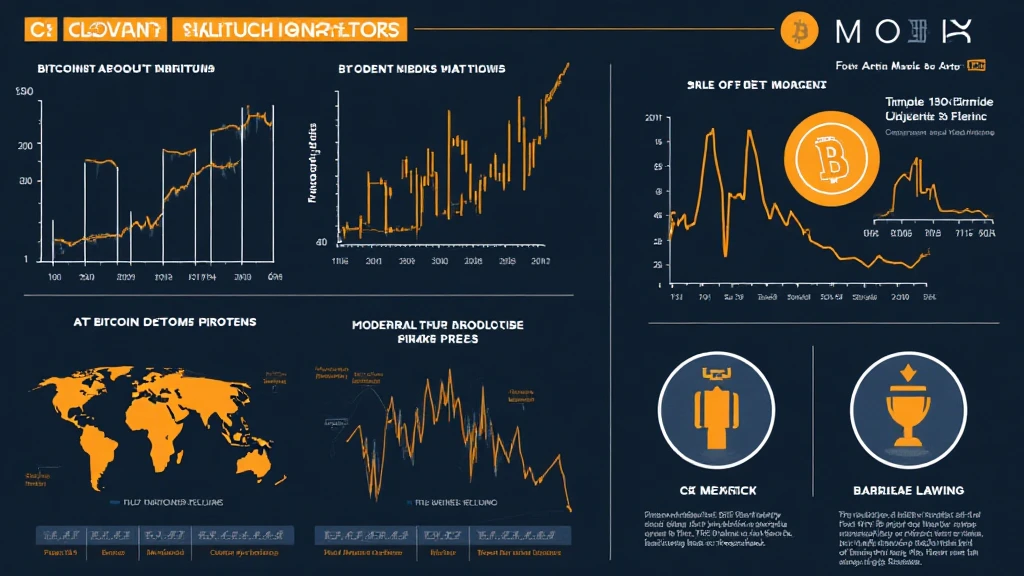
Bitcoin Halving Technical Indicators: Understanding Their Impact
Bitcoin has become a staple in the cryptocurrency ecosystem, and every four years, it undergoes a significant event known as Bitcoin halving. With the next halving anticipated in 2024, understanding the technical indicators related to halving is crucial for investors and traders. Have you ever wondered how these events affect Bitcoin’s market dynamics?
According to Blockchain.com, the previous halving events have led to substantial price increases in the months and years that followed. This suggests a robust pattern worth exploring. As the crypto space continues growing, so do user bases, especially in emerging markets like Vietnam, which saw a user growth rate of over 50% in the past year.
What is Bitcoin Halving?
Bitcoin halving refers to the event where the reward for mining new blocks is halved, reducing the rate at which new bitcoins are created. This occurs approximately every four years, aiming to cap the total supply at 21 million coins.

- 1st Halving: November 28, 2012 – Block reward dropped from 50 BTC to 25 BTC.
- 2nd Halving: July 9, 2016 – Block reward fell to 12.5 BTC.
- 3rd Halving: May 11, 2020 – Block reward reduced to 6.25 BTC.
Each halving event has historically influenced Bitcoin prices, often leading to significant bull runs. By limiting supply, halving instigates increased demand, pushing prices higher. This relationship embodies the classic economic principle of supply and demand.
The Importance of Technical Indicators in Cryptocurrency
Technical indicators are essential tools for traders and investors in the crypto market. They analyze price movements and help forecast future price trends.
- Moving Averages: Used to identify trends by smoothing price data.
- Relative Strength Index (RSI): Measures the speed and change of price movements to identify overbought or oversold conditions.
- MACD (Moving Average Convergence Divergence): Indicates momentum changes by comparing short-term and long-term moving averages.
Each of these indicators can provide insight into how Bitcoin’s price might react post-halving based on previous trends.
Analyzing Past Bitcoin Halvings with Technical Indicators
Let’s break down how these indicators performed during previous halving events.
1st Halving (2012)
During the first halving, Bitcoin’s price surged from around $12 to a high of $1,200 within a year. Technical indicators like the RSI showed strong bullish momentum as investors reacted to the halving.
| Indicator | Value |
|---|---|
| Price before halving | $12 |
| Price after halving (1 year) | $1,200 |
2nd Halving (2016)
The second halving saw Bitcoin’s price rise from approximately $650 to nearly $20,000 by the end of 2017. Indicators pointed to substantial market momentum leading up to and following the event.
| Indicator | Value |
|---|---|
| Price before halving | $650 |
| Price after halving (1 year) | $20,000 |
3rd Halving (2020)
The most recent halving was followed by a rapid increase in Bitcoin’s price, reaching an all-time high of over $64,000 in April 2021. Technical indicators like MACD indicated bullish trends as excitement built ahead of the halving.
| Indicator | Value |
|---|---|
| Price before halving | $8,500 |
| Price after halving (1 year) | $64,000 |
What to Expect in 2024?
As we approach the next halving, keen traders will certainly be analyzing technical indicators closely. It’s crucial to understand how these indicators can predict market moves.
- Look for bullish signals in the RSI as the halving approaches.
- Monitor moving averages to identify possible breakout points.
- Use MACD to gauge momentum shifts as supply decreases.
Each halving paints a unique picture worth analyzing, and 2024 may present opportunities similar to those of past events.
Lessons from Vietnam’s Crypto Market
Vietnam’s crypto landscape provides a compelling case study for understanding market influences. With a user growth rate exceeding 50% in recent years, Vietnamese users are increasingly adopting BTC.
Utilize insights from successful traders within the region and observe how they leverage technical indicators during halving events. This can provide valuable benchmarks for international traders.
- Traders often enter positions based on halving expectations, leading to early price movements.
- The Vietnamese market is influenced by news cycles, making social sentiment vital to monitor alongside technical indicators.
By understanding these dynamics, you can forecast behavior more accurately and make informed trading decisions.
Conclusion: Navigating the Future of Bitcoin Trading
In wrapping up, understanding the Bitcoin halving technical indicators will arm you with the tools needed to navigate the Bitcoin market effectively. The next halving in 2024 could script a notable chapter in Bitcoin’s journey. Will you be prepared?
As we look forward to another significant price shift in Bitcoin, utilizing these indicators could just be the game-changer you need to optimize your trading strategy.
For more insights on cryptocurrency trading and investment strategies, be sure to check out coincollectorcentral.
Author: Dr. An Nguyen, a cryptocurrency expert with over 15 published papers on blockchain technology and a consultant for various crypto projects in Vietnam.


